UBCGrades 2022 Year in Review
In 2021 I transitioned the website away from Google Analytics to more privacy-friendly Plausible analytics. Combined with website support for sharing of pages, we can observe what people have been looking at on UBCGrades. The dataset used here are visitations to the website in 2022. In 2022, UBCGrades.com witness nearly 3 million lookups on the website, not including ones leveraging the API. For a student body of around 70 thousand, this puts an average of 4.2 lookups per student over the year. CloudFlare estimates we have served over 100GB of traffic in 2022 (the bulk of which are JS and CSS).
Without further ado, let's jump into the plots.
Campus
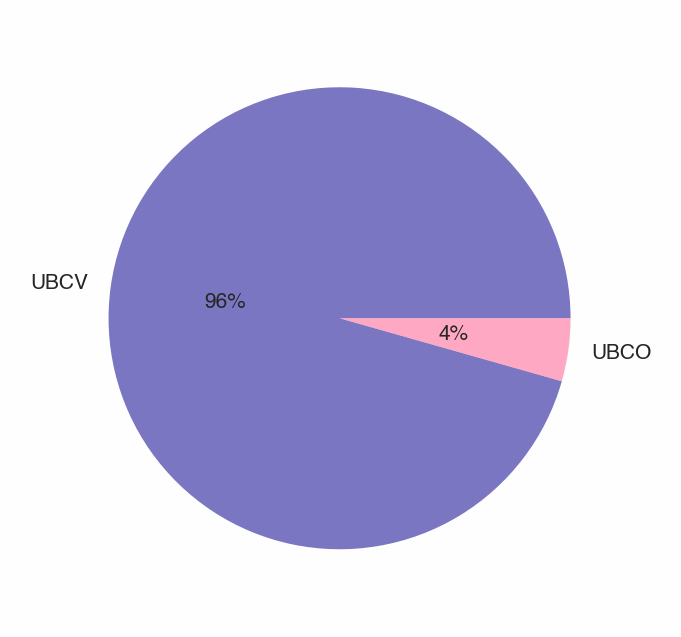
The vast majority of people visiting the website are interested in UBCV, despite having only 82% of the combined student body. Although the following plots will include data from UBCO, one can assume the data is not very representative of UBCO. Saves me time having to make separate plots for each.
YearSession
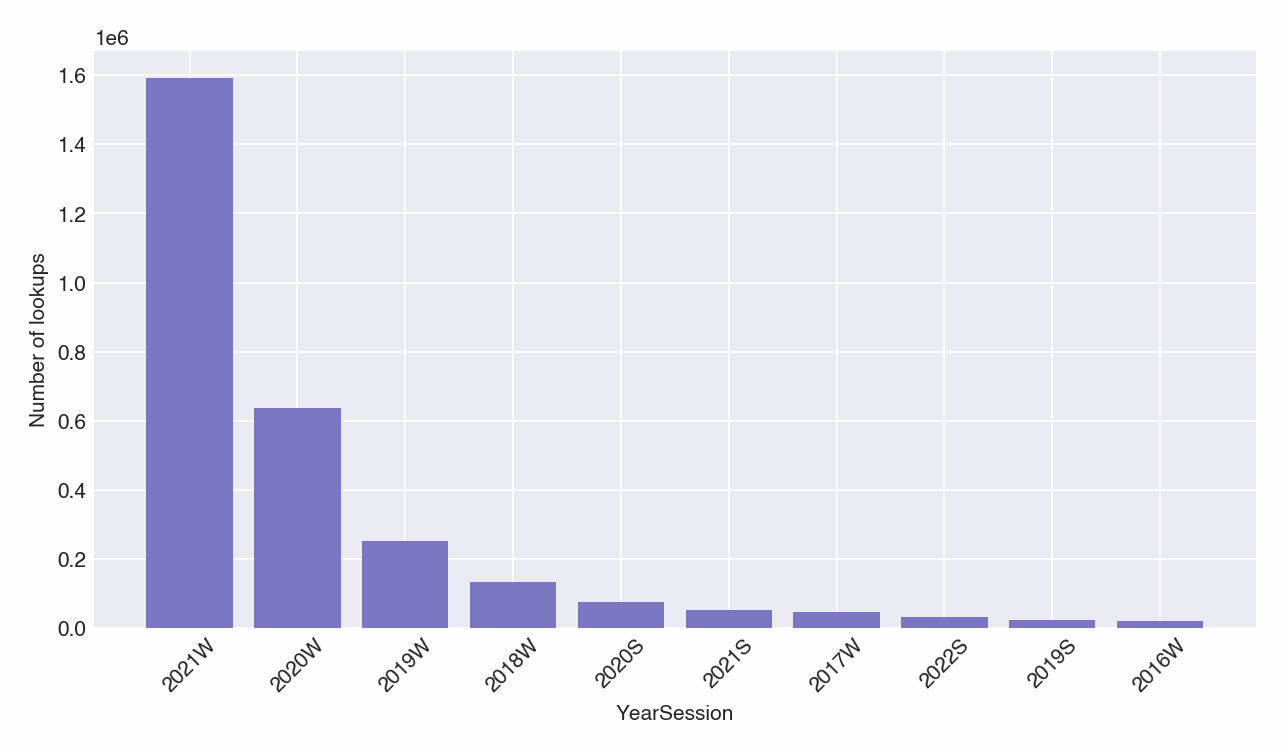
Unsurprisingly, the most popular lookup year is 2021W. I assume 2020W has a strong popularity because 2021W data was added in the middle of the year, and that some students may opt to observe the less recent years. This is shown by each subsequent winter session having fewer lookups than the next. What's interesting is that the summer sessions are far less popular than students even observing data from three years ago!
Subjects
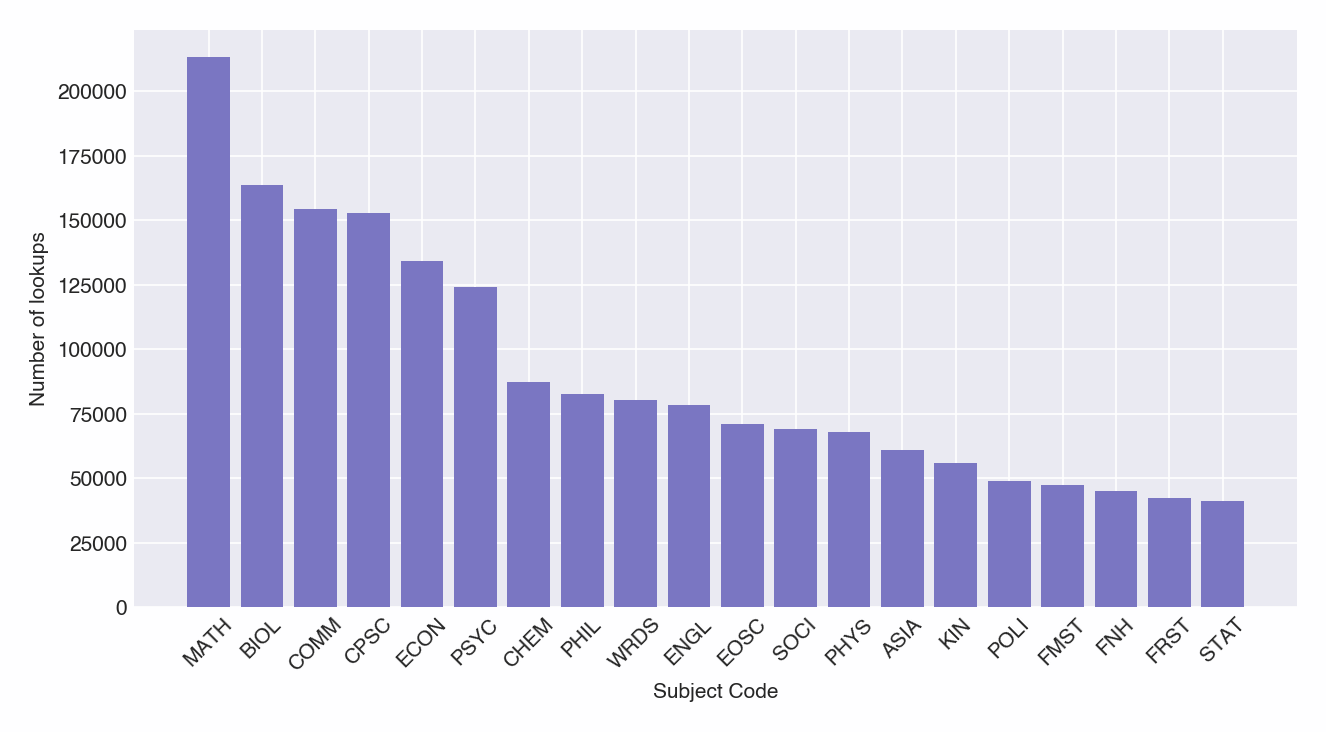
Next we have subjects. It was not obvious to me that MATH would be highly sought out. One might conjecture that MATH is the largest subject code that students across all disciplines take, or that students hear a lot about MATH 100/101 on the UBC subreddit and try to make strategic choices. Or, it might just be that MATH has far more courses and sections to offer than any other subject.
Courses
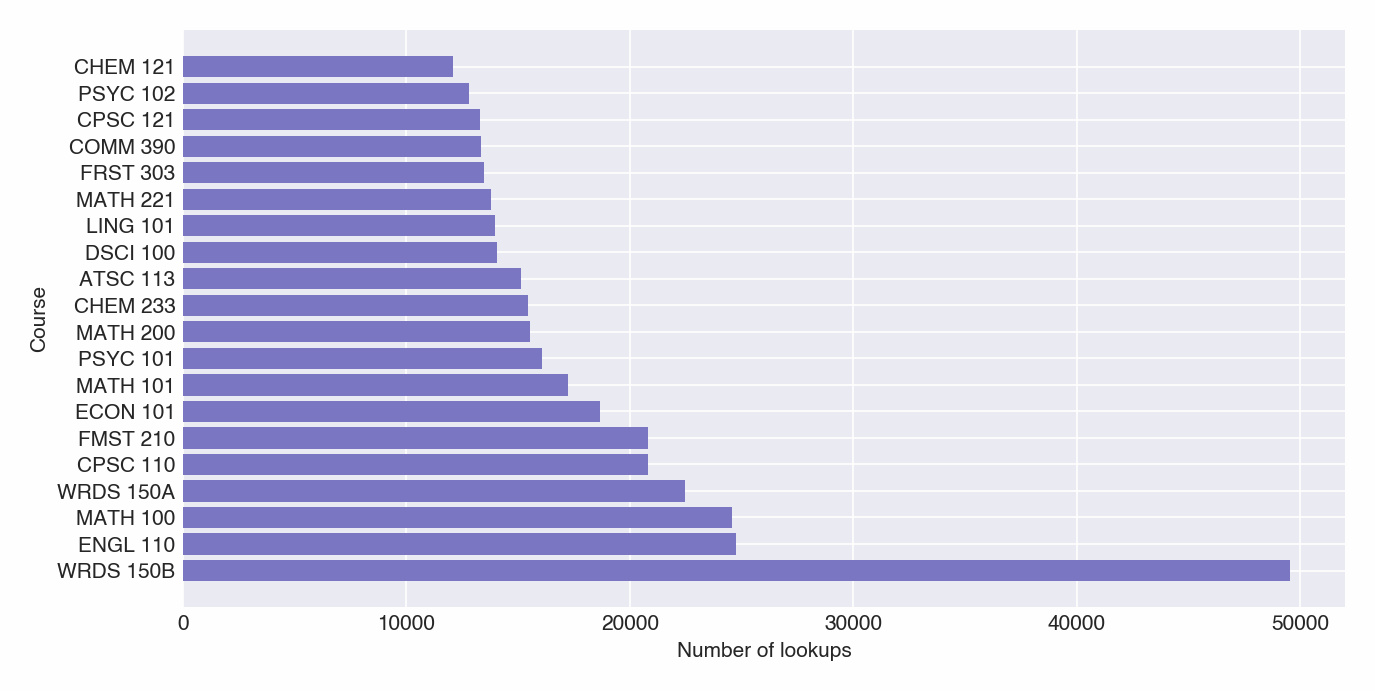
From our subject plot from before one might guess that a MATH course would be the most looked up, but that is not the case. WRDS 150 are in the top. This is puzzling until one remembers a univeristy-level writing course is required by many degrees and that, for example, WRDS 150B has over 40 sections in one term. I imagine people are going back and forth between sections, resulting in its popularity. The same applies to ENGL 110, a WRDS 150 alternative.
Then, as a surprise to no one, MATH 100 ranks the highest among STEM courses.
Sections
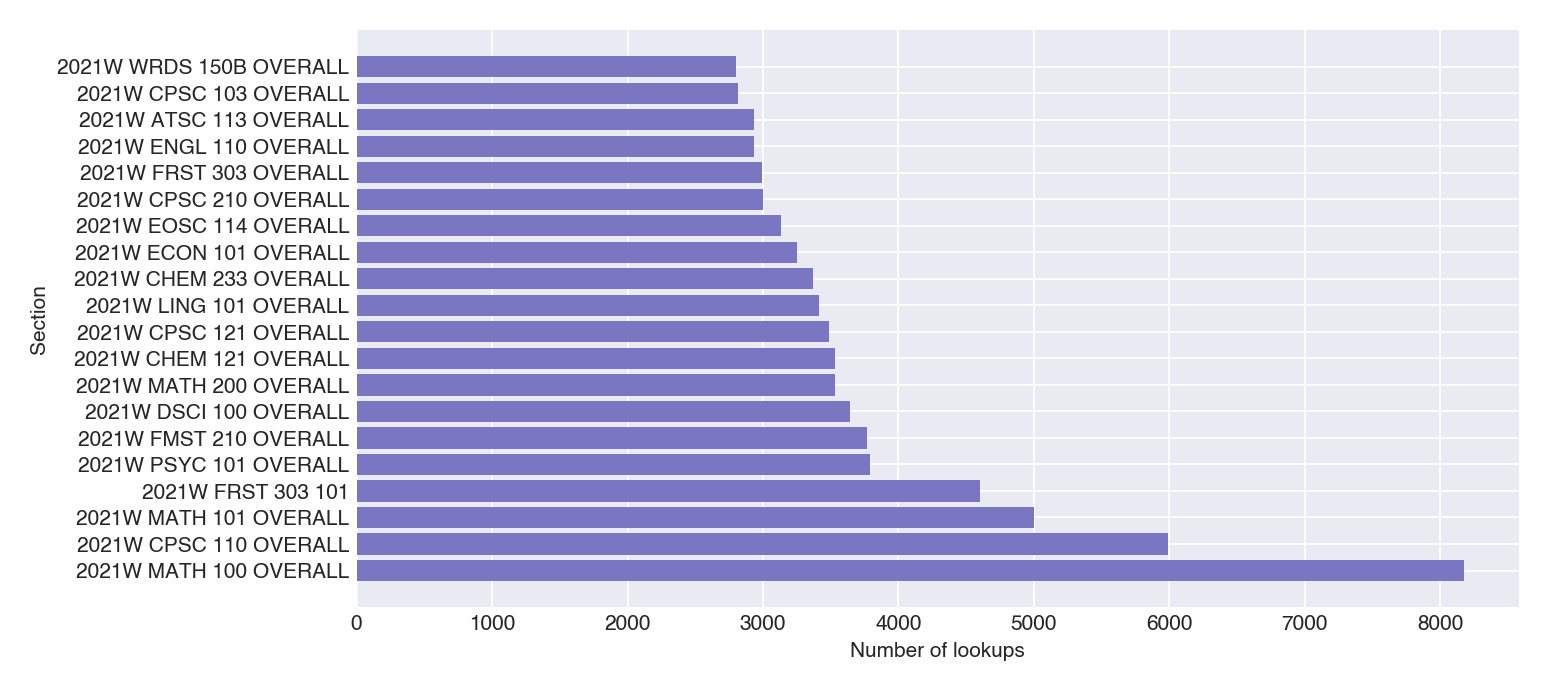
OVERALL sections, sections that combine the data of all the constituent sections of a course, are most popular. This is even despite the website state machine prefering single sections where possible. Having an easy overview of all sections for that particular course in a yearsession is handy.
Again, MATH 100 takes the crown. WRDS 150 and ENGL 110 are much lower. This is likely due to the much larger sectional varation in those courses, attributed to the more subjective assessment of the course.
We can make this a bit more interesting if we remove OVERALL sections from our ranking.
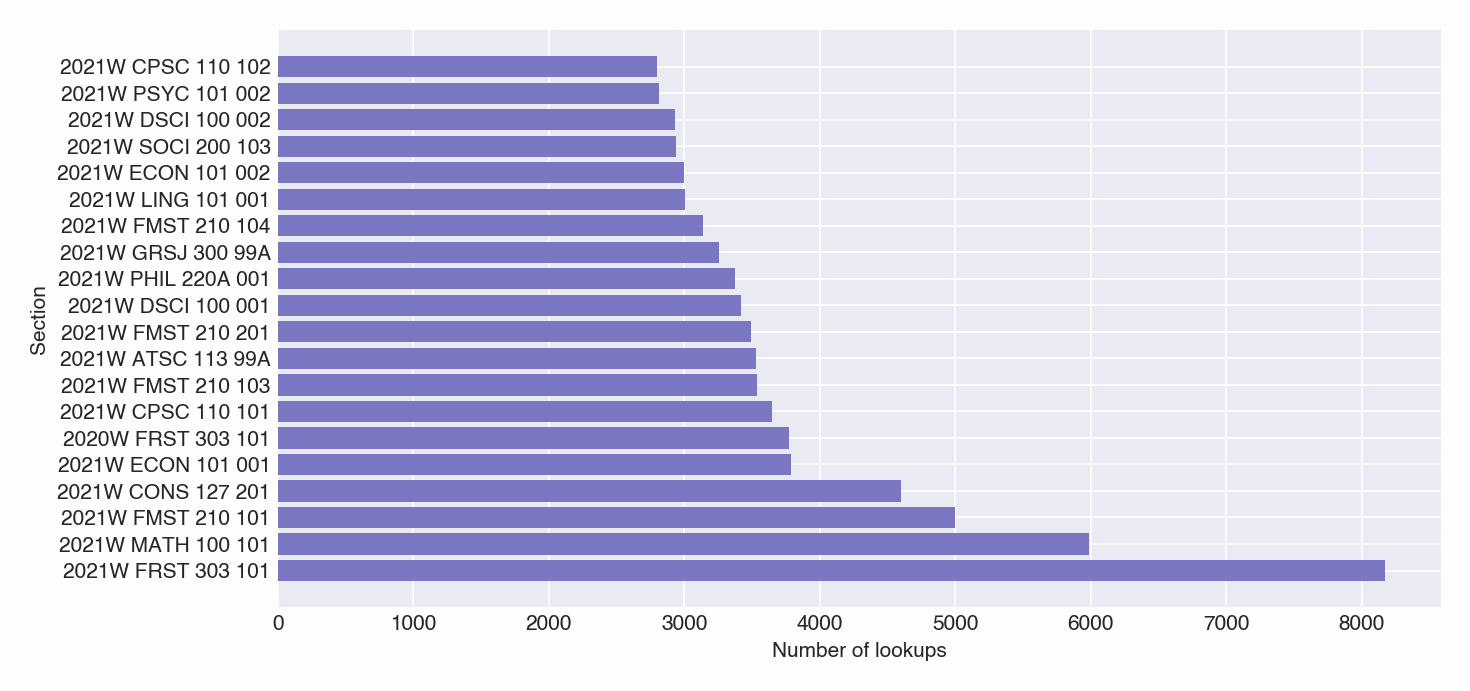
Why is FRST 303 so popular? I might have had an influence on it, showing that in recent years, grade averages in FRST 303 shot up. I posted that to Reddit, and the rest is history. It's crazy what influence is possible when you have some numbers on a plot.
Course Level
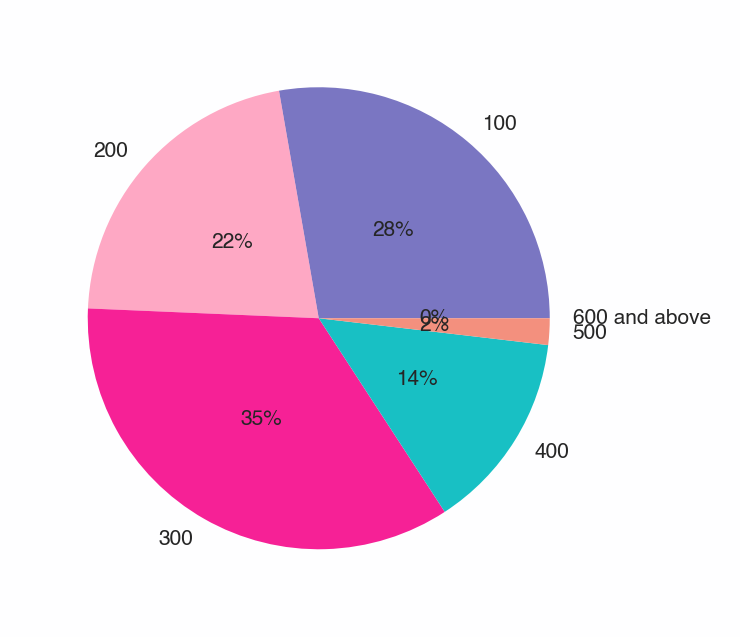
Here we see a breakdown of lookups by the level of the course. As one can imagine, 100 level courses are popular as the number of sections is large to accomodate general and common first year curriculums. But, 300 levels are the most looked up. This might be due to the flexibility in the year level of the student that can take such courses. 400 level dwindles, as many such courses only have one section.
I would wager that a pie chart showing the distribution of course levels by number of sections might also yield a similar plot.
What are in the 600 level and above section? Generally PhD students would enroll in a 600 level course for their dissertation. What is above 600? I looked this up and there was only one course that someone looked up: DENT 769 Foundation of Teaching and Learning for Dental Graduate Student Instructors (GSIs). There are more 700 level courses from DENT.
I did not find an 800 level course in this particular dataset.
Daily Traffic
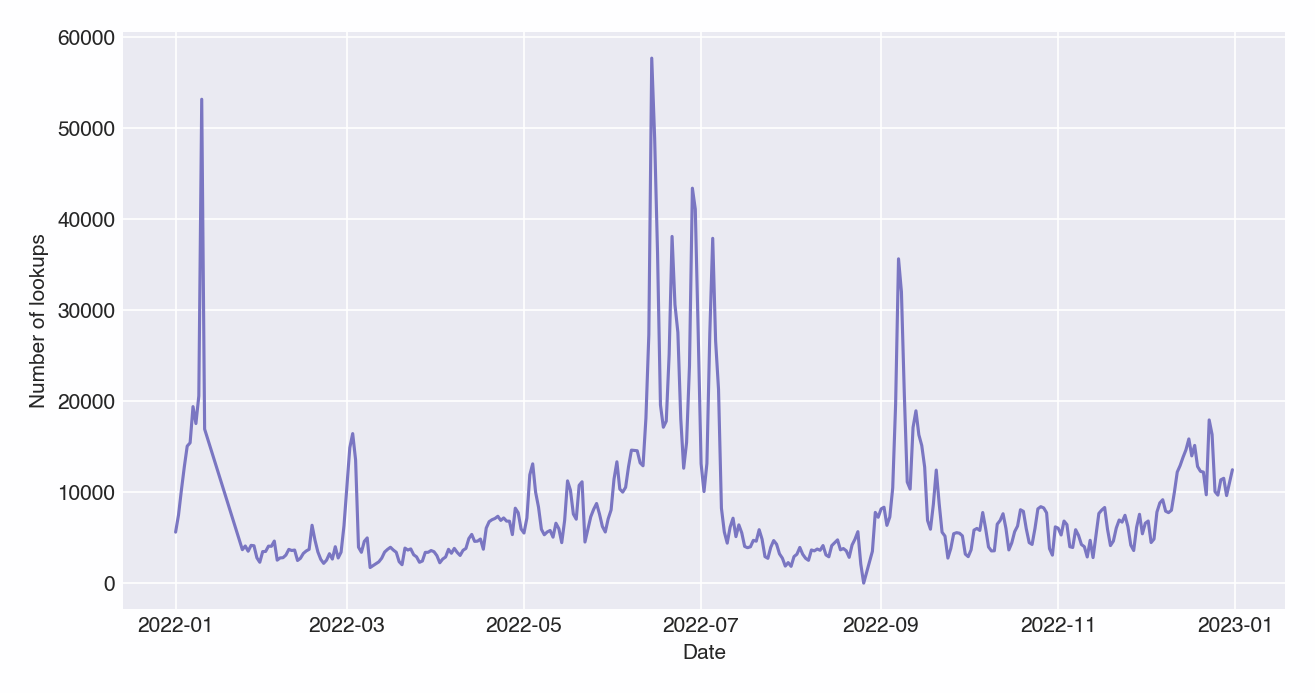
The peak daily traffic observed here was on 2022-06-14 with 57728 lookups. These peaks correspond to important registration and exam dates. The first peak is the start of the Term 2 of the Winter session. Unfortunately there was a period of downtime after this, so that linear decrease should be ignored. Around March was Summer session registration. In May we have the start of the Summer session and the release of 2021W data. Then the big period in the summer are Winter registration, with the weekends being less active. In September we have the start of Term 1 of the Winter session. One can also observe in April and December a slight rise in activity, likely due to the exam period.
Requests by Country

Unsurprisingly, Canada ranks the highest in where people look up data. The following table shows the top 10.
| Country | Number of Lookups |
|---|---|
| Canada | 2679901 |
| United States | 52805 |
| China | 35167 |
| India | 32012 |
| Hong Kong | 19559 |
| South Korea | 11036 |
| United Arab Emirates | 10856 |
| Taiwan | 7421 |
| Japan | 5208 |
| Singapore | 5003 |
Side-thoughts
When I first started out this whole grade data project. It was borne out of a curiosity to sate certain questions like "Does MATH award higher grades than PHYS" for example. That question on its own has many sub-questions that could be asked such as "are there discrepancies among year levels?". With the old PAIR dashboard, answering such questions was difficult, and one could only get a general idea within a reasonable time constraint. Thus I went on a hunt for the data, and answered some of them. Then I wanted others to be able to do the same thing, and built UBCGrades so that access to the data was easier, and not having to fill out a CAPTCHA to do so. A part of that was also to get somewhat familiar with web development, to gauge my interest in it.
However, with the data shown here and an example I will present in the following paragraphs, today people unfortunately use the data spitted out by UBCGrades as "which courses should I take to maximize my average grade" or "which courses are easy" or "does this professor grade harshly in this section compared to another". I am definitely responsible for this, but if that's what people want to use the data for, so be it. I make no claims on the accuracy of the data and how useful it is to help in such cases.
One of the things I think about when maintaining UBCGrades is whether availability of such data does more harm than good. I have a feeling it encourages people to "game the system".
For example, in the plots of section lookups, FRST 303 was among the most popular. This is not by coincidence, as mentioned before, a previous post showed that FRST 303 awarded much higher grades compared to previous sections in 2021W. Exacerbated by my Reddit and blog posts, it is clear many students enrolled in FRST 303 for a GPA booster, possibly done out of zero interest for forest science. The forestry department definitely witnessed the surge in enrollment, such that in 2020W, 170 students were enrolled. In 2021W, this increased to 322 enrollees with a course average of 97, 3 points greater than in 2020W. For 2022W, it is now an Online course with a staggering 1643 enrollees at the time of writing. I am not sure if this is a good or bad thing, that from a single post, demand for a course increased over 8x in a course of two years. I'm not sure what goes on behind the scenes increasing course capacity like this, so I have no clue if the Forestry department benefits from this.
The other thing I worry about are that students may not choose to take a course with a professor if a section they taught or co-ordinated awarded low grades. I worry that users of the website would establish a causal relationship and avoid what might turn out to be an a great course. For this reason I will refrain from adding an option to view grades by professor names. There are interesting questions to discuss shown by this reddit post. Of course, you are welcome to use the raw data to build your own tools.
All of this rambling to say that you should avoid viewing UBCGrades as a tool to help you decide on what courses to take or sections to enroll in. It's unfortunate that medical, law, and grad schools require you to have a 106% average with 50 volunteer positions and curing cancer as a side project to be a good candidate, but in my opinion, what you take away from the course is far more important than your ability to do well in assessments. I know it doesn't feel that way.
Closing
As a hobbyist web developer, it's great to see what started out as a simple side project evolve to this state. Although I have long graduated from UBC, I will continue to support the website as long as it is simple to obtain the data and my interest still holds. I hope users can leverage the API or the raw data and ask more interesting questions than simply looking up sections and aiding them in their GPA booster search.